The basic KNW datasets are stored in the KNMI Data Centre (KDC). In KDC you can use filter term “KNW” (the “What” filter function) to get to the model data. There are a few basic datasets that contain exactly the same data, but are organised differently, in different formats or for different time periods to suit different users that are summed up below. The datasets can be downloaded, but before doing so, please also read the user manual.
Note: The KNW-atlas originally covered a 35 year period (1979-2013). All the validation reports and images in the library that are presented on this website are based on these 35 years. But the KNW dataset itself is available for 40+ years (1-1-1979 00 UTC until 31-8-2019 18 UTC), because it has been extended to the end of ERA-Interim in the DOWA-project.
Different data users
- KNW (KNMI North Sea Wind) Atlas - wind – at 10-200 meters above the North Sea from all 2.5 km grid locations of the model in files containing 1 day: here you will find NetCDF-files organised in daily files for a fixed domain (the “KNW-domain” described in figure 4 of the manual). You can select a day and download all available information for that day (23 values from 01 until 23 UTC and one from the next day the 00 UTC) in one go. The daily files are available for 5 weather parameters (temperature, wind speed and direction, pressure and specific humidity) and the units are included in the file. Each daily file is for a given height above mean sea level (10, 20, 40, 60, 80, 100, 150 and 200m are available). Considering the 3D files for each of the 8 heights together provides a 4D description of the lower atmosphere. The original set consisted of 35 years of 365/366 days. In december 2017 the set will be expanded to include 2014 until September 2017. After that extra months will be added with a 3-4 month delay until the last month August 2019 (added before the end of 2019). This is part of the DOWA-project.
- KNW (KNMI North Sea Wind) Atlas - wind – model time series of 35 years at 10-200 meters above the North Sea in individual 2.5 km grid location files: there are 2 datasets with this name; one in ASCII (csv/text) format and the other in netCDF format. The files are organised per location (170x188 grid cells with central point in lat/lon) in the “KNW domain”: you can select a grid cell location and download all available time series for that location in one go (35 years: 1979-2013). Output variables are temperature, wind speed and direction, pressure and specific humidity on 8 levels (10, 20, 40, 60, 80, 100, 150 and 200m).
- KNW (KNMI North Sea Wind) Atlas wind - model time series from 2014 up to present at 10-200 meters above the North Sea in individual 2.5 km grid location files: there are 2 datasets with this name; one in ASCII (csv/text) format and the other in netCDF format. The files are organised per location (170x188 grid cells with central point in lat/lon) in the “KNW domain”: you can select a grid cell location and download all available time series for that location in one go (the length of the time series will be 3 years and 8 months when the data are downloaded in december 2017; after the last update in July 2019 the length of the time series will be 5 years and 3 months). Output variables are temperature, wind speed and direction, pressure and specific humidity on 8 levels (10, 20, 40, 60, 80, 100, 150 and 200m).
The basic daily dataset for 1979-2013 was already fairly large: 170x188 (domain size) x 24x365x35 (hourly output over 35 years) x 8 (levels) x 5 (variables) which is in total about 400 x 109numbers (1.5 terabytes). The dataset with ASCII CSV-files was smaller (0.75 terabytes). Adding extra years will of course make the datasets larger.
Dedicated KNW datasets
The dedicated datasets are based on the same information as the basic 1979-2013 KNW datasets, but have either been used to calculate values that are useful for wind energy purposes and/or are extracted for a specific location. These datasets can be viewed on this website in the image library and both the imagery presented there and the underlying data (NetCDF and ASCII-CSV) are stored in KNMI Data Centre (KDC). Once in the KDC, you can use filter term “KNW” to get to the model data and you will find the dedicated KNW dataset in the "END USER PACK" (contains one zipped dataset).
Wind gust files
From the mean wind speeds in the KNW-atlas, 3 second wind gusts are derived. The maximum wind gust values for 1979-2013 and the 10, 50 and 100 year return values can be downloaded here (NETCDF) and maps are available in the image library of this website. The underlying scientific report can be found in the publication list of this website: "Klimatologie van extreme windvlagen" report (in Dutch) and "An effective parametrization of gust profiles during severe wind conditions".
Supplementary files
Grid domains and point locations
The KNW domain is a rectangular grid with grid cell (001,001) in the southwest and (170,188) in the northeast corner where the x in (x,y) increases from west to east and y from south to north. The Borssele domain consists of 14 x 14 grid points of the KNW domain, more specifically the grid points within the rectangle with grid cell (035,051) in the southwest corner and (048,064) in the northeast corner.
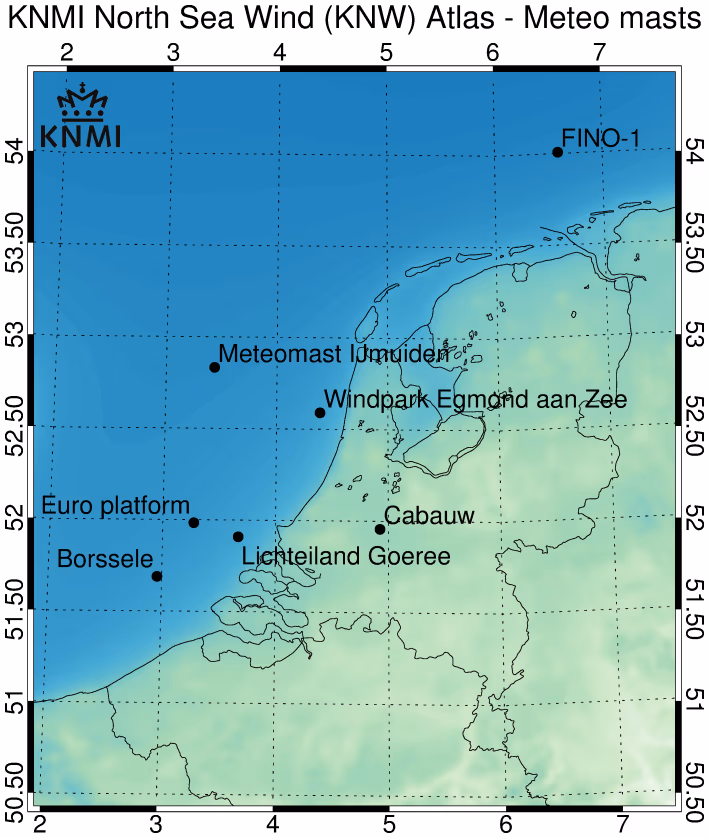
(In the text a Map of 2D domain, Borssele domain and a map with the locations of specific masts)
Image: KNMI
KNMI North Sea Wind Atlas - standard domain
Image: KNMI
Borssele windfarm area
Image: KNMI
KNMI North Sea Wind Atlas - meteo masts
Grid point locations
The links below are to conversion tables to translate the coordinates of the location of interest into the KNW atlas index of the corresponding grid cell. The index of the grid cell is the last part of the filename containing the downloadable time series for that grid cell. In this example, KNW-1.0_H37-ERA_NL-040-180.zip, the 040 is the part of the grid cell index (with values from 001 to 170) that shows how far east the grid cell lies and the 180 is the part of the index (001-188) that shows how far north; so this grid cell lies in the far north of the KNW domain. The conversion tables have 188 rows and 170 columns. The east-west index (corresponding to longitude and the RD coordinate, x) increases from left to right up to 170 as one would instinctively expect. The north-south index is the opposite to what one might expect: it increases from top to bottom (up to 188) with the low values at the top corresponding to the south end of the KNW domain and the high values at the bottom corresponding to the north. The value in the lat/long conversion table in row 180 and column 040 is “2.97/54.45” which means 54.45° N, 2.97° E or in minutes (’) and seconds (’’): 54° 27’ 00’’ N, 2° 58’ 12’’ E. In the RD-coordinate table, the value is “2041/720640” which means x = 2041 meters and y = 720640 meters. If you open the table in a spreadsheet, such as EXCEL, the spreadsheet might interpret the “/” as a division and display the result but the coordinates can still be seen if you click on the spreadsheet cell of interest.
GridPointLocations_lonlat: <CSV file> and <Excel file>
GridPointLocations_RD: <CSV file> and <Excel file>
GridPointLocations.nc (NetCDF)
FTP file listings
These two files contain lists of the basic data set file names and can be used in combination with a script to automate the downloading of the large number of files.
ftp_list_KNW-NetCDF-3D.txt
ftp_list_KNW-NetCDF-TS.txt
ftp_list_KNW-CSV-TS.txt