The participants are asked to run the case with their full Single Column Model including their soil-vegetation and radiation modules. For models of operational institutes please run the SCM with the same vertical resolution as the operational run. In that case you are welcome to send in a second run with higher resolution. The initialisation and forcings for the model run are decribed in this section. Model output and its format for the intercomparison are decribed in the section "Output". If your model is not capable of comforming to set up please contact us. Since important parts of the Cabauw observations are freely available their is no possibility to hide them from the participants. Please do not tune your model to this specific case.
Profiles and time series are given at the nodes of piecewise linear function. Thus the user should perform linear interpolation between this nodes when needed for his specific purpose. When two node values at the same height or time are given, a jump (discontinuity) is implied. The first value should be prescribed up to the height or time specified. At the next model level or model time step the second value should be prescribed.
Location
Cabauw, The Netherlands (51.9711o N, 4.9267 E, -0.7 m ASL)
Period
1-Jul-2006 12:00 UTC - 2-Jul-2006 12:00 UTC
Surface parameters
Albedo
a = 0.23
(If you model discrimates between NIR and VIS, use same values for both bands. The band albedos are not known for Cabauw)
Emmissivity
epsilon=0.99
Roughness length for momentum
z0m = 0.15 m
Roughness length for heat
z0h = 0.0015 m
Vegetation fraction:
100% grass
Leaf area index:
LAI = 2.
Soil water content
If possible prescribe soil type as clay. Typical values for constituents are: 45% clay, 8% organic matter, no sand.
soil water content at field capacity is 0.47 m3/m3
Initialise the model soil water content such that the Bowen ratio = 0.33 at the start of the simulation (i.e. 20060701 12:00 UTC)
Initial conditions
Initial values are valid for 1-Jul-2006 12:00 UTC
Surface pressure 1024.4 hPa
Initial soil temperature profile.
Based on observed mean values 20070701 11-13 UTC at Cabauw
| Depth (m) | Temp (oC) |
|---|---|
| 0,00 | 23,4 |
| 0,02 | 22,2 |
| 0,04 | 21,4 |
| 0,06 | 20,6 |
| 0,08 | 19,8 |
| 0,12 | 19,0 |
| 0,20 | 17,9 |
| 0,30 | 17,5 |
| 0,50 | 16,0 |
| 1,00 | 12,2 |
| 2,00 | 10,0 |
| inf | 10,0 |
Note: Models where the top soil layer is in direct contact with the atmosphere (thus no skin layer) do need some spin-up time.
Initial atmospheric profiles.
From radiosounding De Bilt (20 km NE from Cabauw)
Lowest 200 m from Cabauw tower observations
Temperature and Specific humidity
| Z (m) | T(oC) | q (kg/kg) |
|---|---|---|
| 0 | 27,0 | 9.3 E-3 |
| 2 | 27,0 | 9.3 E-3 |
| 10 | 26,4 | 8.5 E-3 |
| 20 | 26,2 | 8.4 E-3 |
| 40 | 25,9 | 8.3 E-3 |
| 80 | 25,5 | 8.2 E-3 |
| 140 | 24,8 | 8.1 E-3 |
| 205 | 24,3 | 8.0 E-3 |
| 1800 | 9,0 | 7.5 E-3 |
| 2200 | 9,0 | 2.0 E-3 |
| 5000 | -6,4 | 0.3 E-3 |
| 12000 | -61,0 | 0.01 E-3 |
| 14000 | -54,0 | 0.003 E-3 |
| TOA | -50,0 | 0.000 E-3 |
Wind speed
U is zonal positive West to East moving wind, V is meridional, positive South to North moving wind.
| Z (m) | U (m/s) | V (m/s) |
|---|---|---|
| 0 | 0.0 | 0.0 |
| 10 | -4.0 | -0.4 |
| 353 | -5.5 | -0.5 |
| 1238 | -5.5 | -0.5 |
| 2000 | -2.0 | 2.0 |
| TOA | -2.0 | 2.0 |
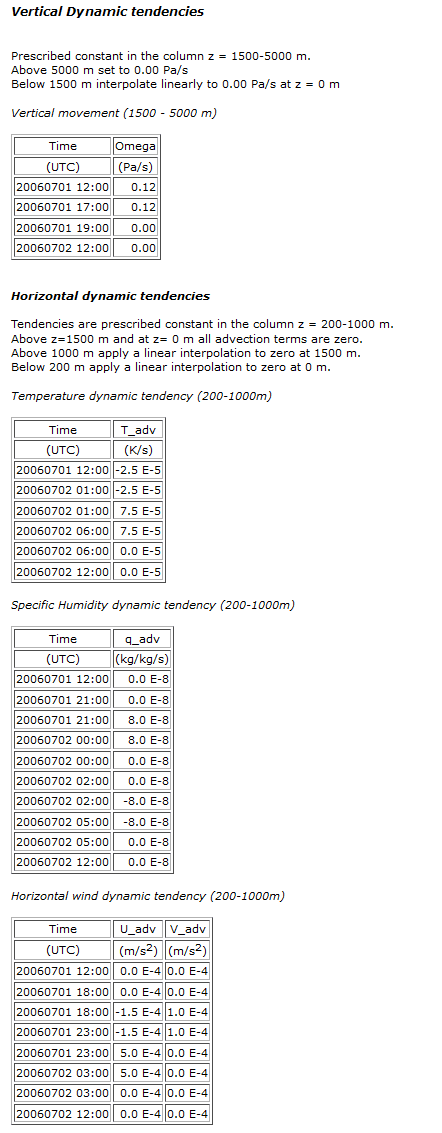
Atmospheric forcings
Geostrophic wind
Surface geostrophic wind
| Time (UTC) | Ugeo (m/s) | Vgeo (m/s) |
|---|---|---|
| 20060701 12:00 | -7.8 | 0.0 |
| 20060701 18:00 | -7.8 | 0.0 |
| 20060701 23:00 | -6.5 | 4.5 |
| 20060702 03:00 | -5.0 | 4.5 |
| 20060702 06:00 | -5.0 | 4.5 |
| 2006070212:00 | -6.5 | 2.5 |
Geostrophic wind profiles
At each time step interpolate between the prescribed surface geostropic wind linearly to Ugeo=-2.0 and Vgeo=2.0 m/s at 2000 m.
Above 2000 m keep constant with height.