What we found:
- The intensity (precipitation over 1 hour or less) of extreme precipitation is likely to increase with 14% for each degree temperature rise. This is much more than commonly thought.
- The observed upward trend in intense precipitation of 15 % in the Netherlands can be fully explained by the temperature rise in the recent decades.
This was found by:
- Analysing observations from different countries (the Netherlands, Belgium, Switzerland and Hong Kong).
- Present-day (regional) climate models do not sufficiently resolve convective processes to provide reliable estimates of peak intensities and consequently give widely different results.
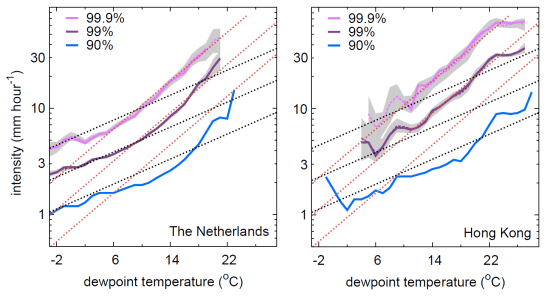
The intensity of extreme showers, as measured by observed hourly precipitation sums, follows a dependency of 14 % per degree. A doubling of intensity occurs each 5.3 degree temperature rise. This figure is derived from observations in Hong Kong (1886-2010) and apprximately 30 stations in the Netherlands (1995-2010).Plotted is the dependency on dew point temperature, which is usually 4-8 degrees below the air temperature.
The primary reason why precipitation extremes are expected to increase is because warmer air can contain more water vapour; the simple argument is that if there is more water vapour in the air also more rain can be produced. This is exactly what is shown in the above figure. What is surprising though is that the increase in intensity is stronger than the increase in water vapour content. For each degree dew point temperature rise ~7 % more water vapour is in the air (the so-called Clausius-Clapeyron relation, given by the black stippled lines), yet the intensity increases with 14% per degree (red stippled lines).
Why care about the dew point temperature? What is the dew point temperature? The dew point temperature is actually not a temperature; it is the temperature at which an air parcel becomes saturated through cooling and is therefore a measure of the absolute humidity (water vapour content) of the air. If the relatively humidity does not change - and there are good reasons for that if we consider climate change in the Netherlands - the dew point temperature rise will be equal to the temperature rise. Even more so, the rise in dew point temperature over Europe as predicted by regional climate models is far more robust than the temperature rise.
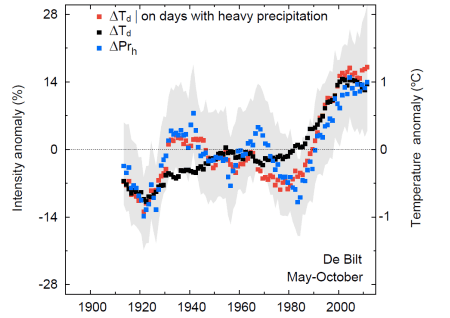
The intensity of extreme hourly precipitation (blue symbols) is at present 10 to 15% higher than before 1990. This increase is likely attributed to the warming of 1 degree in The Netherlands.
The red symbols show the dew point temperature at days with heavy rain. The time evolution of this temperature is very similar to the time evolution of the anomaly in precipitation intensity. This shows that there is a likely link between the dew point temperature at those days and precipitation intensity. This adds to the evidence from the figure (left panel) above which is derived from data of the last 15 years only (using a different analysis methodology).
At the same time the long term trend in dew point temperature on heavy rain days (red) equals the trend in the average dew point temperature (black symbols). Trends in mean dew point temperature and mean air temperature are almost equal, which is consistent with a constant relative humidity as climate changes.
Thus, the temperature rise in the Netherlands over the last decades has caused a equal rise in dew point temperature. The latter is equivalent to a rise in the atmospheric water vapour content, with approximately 7 % per degree rise in dew point temperature following the Clausius-Clapeyron relation. On the longer term, the rise in mean absolute humidity of the atmosphere is reflected in the atmospheric humidity levels during heavy convective events. This gives rise to an increase in intensity of approximately 14 % per degree dew point temperature rise.