
What we found:
- Large scale (on the scale of the Rhine catchment area) precipitation extremes in winter increase at a rate of approximately 3 to 7% per degree due to climate change, much lower than the rate of increase of local precipitation intensity.
- The role of natural variations for this type of extremes is large. Even for 30 year periods natural variations (independent of climate change) are an important contributor to variability.
This was found by:
- analysing a large ensemble of 17 simulations with a global climate model from the ESSENCE project. This type of extreme is governed by synoptic scale low pressure systems, which are reasonably (to well) resolved by climate models.
For more, see published article in Hydrology and Earth System Science.
Natural variability
The climate systems shows natural variations on different time scales, from variations from year-to-year to variations for 10 year periods and longer. Variations that occur irrespectively of human induced greenhouse warming are called natural variability. The amount of natural variability depends on the variable looked at and the time and spatial scale. For the globally averaged temperature it is rather small on a 10-year period; in the absence of human induced climate change the average temperature over two 10-year periods are approximately equal. By contrast, for example, for winter storms in the Netherlands the amount of natural variability is considerable; in one 10-year period several severe storms could hit the Netherlands, whereas in other 10-year periods there could be (almost) no storms. Therefore, it is obvious that to base safety norms of the coastal defense – the present norm is a probability of failure once every 10.000 years or less for highly populated areas – on an observational data set of only 10 years is not a good idea. (Extrapolating to such rare events is done using advanced statistical methods based on extreme value theory). Over longer periods natural variability tends to average out. Yet, even on a period of 30 years – a period normally used to determine a climatology – natural variability can be substantial.
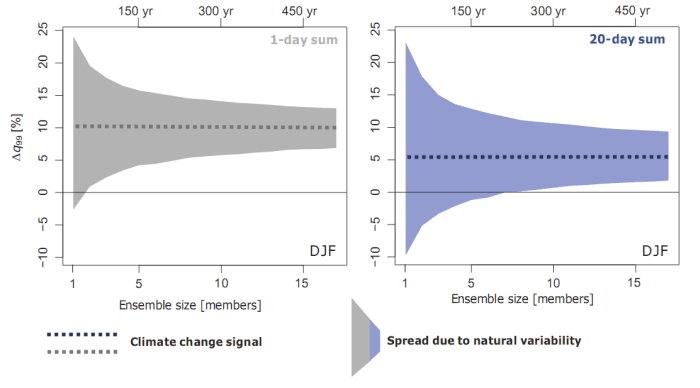
The percentage change in the 99th percentile of precipitation (an extreme occurring on average once a year) between the control period 1961-1991 and the future period 2070-2100 (winter months only) is in the full ensemble of 17 climate model simulations shown by the horizontal dashed lines. This is the climate change signal; it is 11% for 1-day extremes and +6% for 20-day extremes (gray and blue thick stippled horizontal lines, respectively). At the same time, the mean precipitation increases by about +12 %, and the temperature change is ~3 degrees (not shown).
We continue to look at natural variability. If we would have only one climate model simulation, what can we expect. (Here, we used a re-sampling method to provide us with more accurate results; see published paper.) This is given by the dashed area. With ensemble size 1 (that is, only one climate model integration) we could expect an simulated change between -2 and +23 % for one-day sums and -9 and +22 % for 20-day sums. Thus, for 20-day sums, even if the climate change signal is positive (a +6% change) there is a considerable probability that a negative change is obtained from our model simulation. We need 8 simulation to be reasonably certain that we get a positive change (where the blue area is above the zero line). For one day extremes the situation is better, partly due to the greater climate change signal (+11% vs. +6%), partly due to the smaller role of natural variability (the smaller bandwidth).